
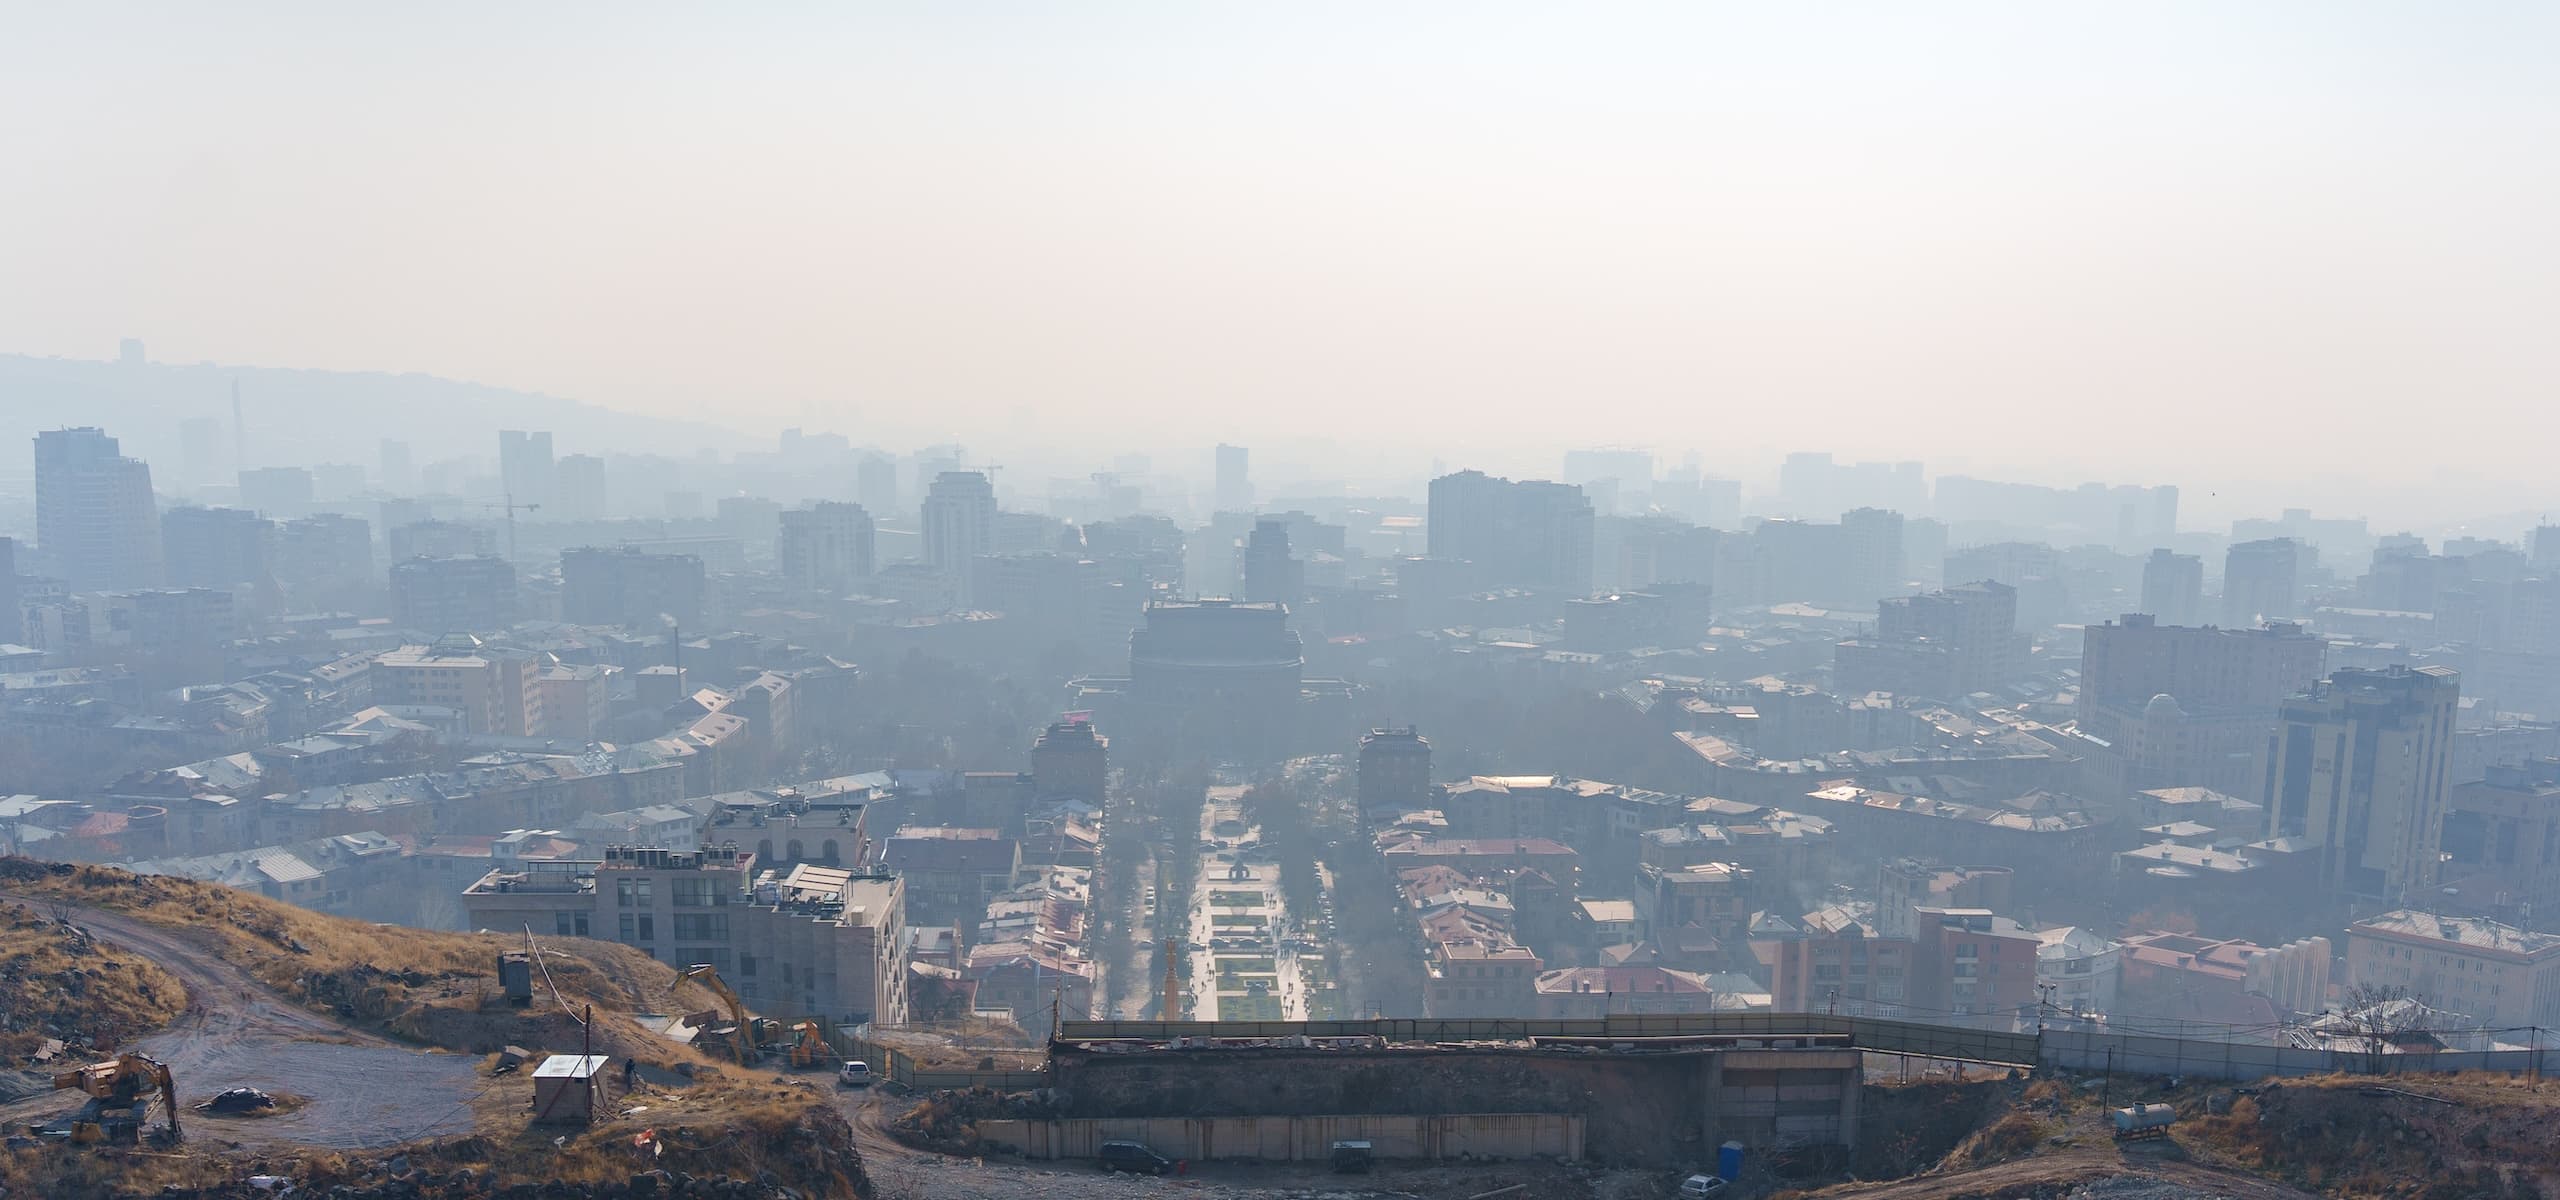
Last winter, Yerevan residents breathed air exceeding the WHO guideline on 138 out of 151 days. The WHO recommends that there should be no more than 2–3 such days a year. On 51 days, the daily average US AQI rose above 150—a level already unhealthy for everyone, not only people with lung or heart conditions. The worst period was January 5 to February 3, with an average AQI of 168.
- Every evening after 19:00, air quality deteriorated sharply, and this was no coincidence. The morning AQI low was around 103, while the evening peak was around 142. The city heats homes, drives, and burns waste in stoves at the same time.
- The municipal sensor network grew from 66 to 89 stations. We now have more data than ever, but public sources still do not make clear what the authorities are doing with it.
- Surveys show that Yerevan residents are deeply concerned about winter air quality.
Without concrete data, discussions about air quality easily get stuck between impressions, emotions, and convenient explanations. That is why we prepared this report as a small study of the data AirQuality.am has collected in Yerevan over the past two years. We want to calmly examine not only the numbers, but also the authorities' statements and promises—and what we should expect next.
What This Report Is About
The report's main indicator is PM2.5: extremely fine particles up to 2.5 micrometers in diameter. They penetrate deep into the lungs and are associated with increased risks to the respiratory and cardiovascular systems. In winter, PM2.5 has the greatest effect on Yerevan's air quality. Read more about PM2.5 and PM10 in our particulate matter section.
In winter 2025/26, the daily PM2.5 concentration exceeded the WHO guideline on 138 out of 151 days, while on 51 days the daily average US AQI reached 151 or higher—a level considered unhealthy for everyone, not only people with lung and heart conditions.
By winter 2025/26, we mean the period from November 2025 through March 2026. For comparison, we use winter 2024/25, from November 2024 through March 2025. In terms of averages, winter 2025/26 does not look much worse than the previous one, but the monthly differences are clear. November was significantly more polluted and drier: drought led to forest and grass fires, while leaf burning and a landfill fire made the situation worse. January was colder and more polluted than the previous year, whereas February and March were somewhat cleaner.
We use the US AQI, the American air quality index that converts pollutant concentrations into a single scale ranging from “clean” to “unhealthy” and “hazardous” air. In this report, AQI is calculated from PM2.5; read more about the scale and its thresholds in our air quality index section.
We also use WHO guidelines: for PM2.5, 15 µg/m³ as a daily average and 5 µg/m³ as an annual average. Read more in our WHO standards section.
Sensors and Data Reliability
The Yerevan.am municipal network is the foundation of monitoring in Yerevan. These are the highest-quality stations in our dataset and were calibrated by Clarity. They are not reference-grade instruments, but research shows that after calibration, sensors of this kind can produce results close to reference measurements. The same sensors are used by AirGradient and Purple Air, with corrections based on US EPA methodology.
An AirGradient study showed that after such calibration, these sensors produce highly accurate results.
- For the ArmAQI and ClimateNet networks, we use our own calibration and compare it against Yerevan's municipal network.
- IQAir is left uncalibrated: comparison with municipal stations did not show that a correction would improve the data.
Different optical sensor models respond differently to humidity, aerosol composition, and installation conditions, so data from different networks cannot simply be mixed as-is. We bring them onto a common scale using the most reliable municipal network as a reference, while accounting for where data has already been calibrated by the provider and where we have corrected it ourselves. Combined with a dense monitoring network, this provides a reasonably reliable citywide picture rather than a collection of random readings from individual devices.
Monitoring Network
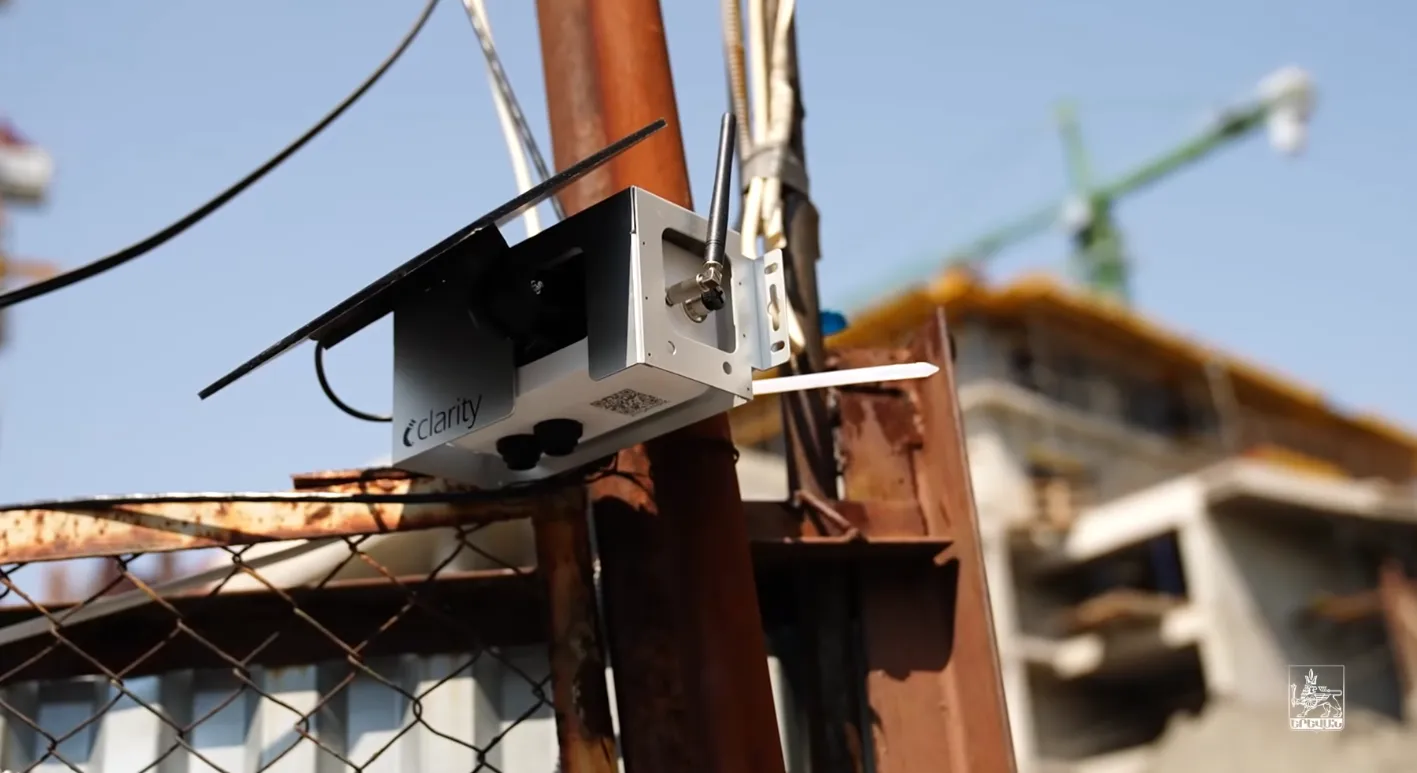
In this report, a “station” means a monitoring location, not every individual sensor. If several sensors are installed near one another—for example, at the same construction site—we count them as one station. The station count below therefore means the number of active monitoring locations.
The tables below show the average number of active stations per day. For each winter day, we count how many locations reported PM2.5 and then average this across the entire period. The municipal Yerevan.am and Clarity stations are combined into one municipal network: they are essentially a single City Hall infrastructure. Detailed Yerevan.am sensor data has been available since late November 2024: Yerevan.am provides only the previous month of history, while AirQuality.am launched in December 2024.
The municipal network grew substantially over the winter, from an average of 66 to 89 active stations per day. ArmAQI also averaged slightly more than the previous winter, rising from 21 to 23 stations. But this does not look like sustained growth: after its 2025 peak, the community network has mostly stagnated and gradually declined. The chart shows that the municipal network delivered the main increase in coverage in winter 2025/26.
Stations in Yerevan by monitoring network
| Monitoring network | Winter 24/25 | Winter 25/26 | Change |
|---|---|---|---|
| Yerevan.am + Clarity | 66 | 89 | +23 |
| ArmAQI | 21 | 23 | +2 |
| IQAir | 3 | 5 | +2 |
| Purple Air | 4 | 4 | 0 |
| AirGradient | 0 | 2 | +2 |
| ClimateNet | 2 | 2 | 0 |
Stations by Yerevan district
| District | Winter 24/25 | Winter 25/26 | Change |
|---|---|---|---|
| Arabkir | 17 | 24 | +7 |
| Kentron | 24 | 29 | +6 |
| Malatia-Sebastia | 8 | 13 | +5 |
| Avan | 4 | 8 | +4 |
| Nor Nork | 9 | 11 | +2 |
| Davtashen | 6 | 8 | +2 |
| Erebuni | 1 | 3 | +2 |
| Nork-Marash | 3 | 4 | +1 |
| Ajapnyak | 6 | 6 | 0 |
| Shengavit | 8 | 8 | 0 |
| Kanaker-Zeytun | 12 | 12 | 0 |
Kentron and Arabkir lead in station count; both are centers of heavy traffic and active construction. Coverage in Shengavit and Kanaker-Zeytun barely grew, although these are industrial districts with private homes that are heavily heated in winter. Erebuni, the district closest to the Nubarashen landfill, has remained at only one to three stations for two winters. Network expansion would be most valuable here, revealing the effects of landfill smoke, garages, and private homes.
Comparison with the Previous Winter
To compare winter 2025/26 with the previous winter, we examine monthly US AQI, the number of days exceeding the WHO daily guideline, and average temperature. Here, a WHO exceedance means a day when the daily average PM2.5 was above 15 µg/m³.
| Metric | November | December | January | February | March | |||||
|---|---|---|---|---|---|---|---|---|---|---|
| 24/25 | 25/26 | 24/25 | 25/26 | 24/25 | 25/26 | 24/25 | 25/26 | 24/25 | 25/26 | |
| Average AQI | 105 | 142 | 146 | 145 | 139 | 158 | 111 | 106 | 85 | 68 |
| Average daily minimum/maximum AQI | 73–141 | 109–186 | 113–177 | 105–184 | 113–162 | 120–199 | 88–134 | 75–143 | 67–112 | 50–87 |
| Days exceeding the WHO guideline | 25 | 30 | 30 | 30 | 31 | 30 | 26 | 27 | 26 | 21 |
| Days with AQI 150+ | 2 | 12 | 20 | 16 | 19 | 19 | 5 | 4 | 0 | 0 |
| Average temperature | 6.2 °C | 7.9 °C | 0.9 °C | 1.4 °C | -0.8 °C | -3.4 °C | -1.5 °C | 4.1 °C | 8.4 °C | 5.3 °C |
| Total precipitation | 9.4 mm | 0.9 mm | 5.8 mm | 14.0 mm | 3.2 mm | 10.8 mm | 6.4 mm | 26.2 mm | 13.7 mm | 18.6 mm |
By average AQI, winter 2025/26 was close to the previous winter, but the monthly differences are clear. November was much more polluted: 142 versus 105 the previous winter. There was almost no rain—just 0.9 mm for the month—while forests, grass, leaves, and waste burned around Yerevan. December's average AQI was almost identical to the previous year. January became more polluted amid colder weather: -3.4°C versus -0.8°C. February and March, by contrast, were wetter and somewhat cleaner by AQI.
Daily Pollution Pattern
To determine whether pollution follows a daily pattern, we examined how AQI changes over the course of a day.
The charts below show the average US AQI for each hour of the day, calculated from PM2.5. To prevent isolated extremely low or high values from distorting the chart, we excluded the lowest and highest 1% of hourly PM2.5 values.
The most polluted continuous 30-day period was January 5 to February 3, 2026. Average AQI during this period was 168.8.
The minimum occurs in the early morning, when urban activity is lower and pollution gradually disperses. AQI then rises again during the day and peaks around 20:00–21:00. During the 30 most polluted days, AQI remains high almost all day: even the morning minimum exceeds 140, while the maximum shifts into the afternoon and evening.
A daily chart alone cannot identify the pollution source precisely. But this pattern does not fit well with the City Hall account, which emphasizes construction and industry. It calls for closer attention to other sources: traffic, heating, and the accumulation of pollution over the course of the day.
Causes of Winter Deterioration
Winter's defining feature is that several sources operate simultaneously. Hetq wrote in November that cold weather worsens the problem not only because of meteorology, but also through burning leaves and waste and using firewood for heating. A separate piece on Yerevan's winter air chemistry explained how traffic and heating emissions can accumulate near the ground, while gas boilers—even without visible smoke—add precursors of secondary particles. This aligns well with our daily charts: pollution gradually rises toward evening as traffic, heating, and accumulated pollution overlap.
Burning leaves and waste remains a separate, visible problem. In late November, media reported a series of fires across Armenia linked to burning dry leaves and stubble. In Yerevan, the fine imposed on Greenery of Yerevan is particularly telling: the company was penalized for deliberately burning branches and leaves on a site between the Avan Football Academy and Acharyan Street. This does not reveal the full scale of the problem, but shows why announcing a ban is not enough: burning is done not only by private residents, but also by city organizations.
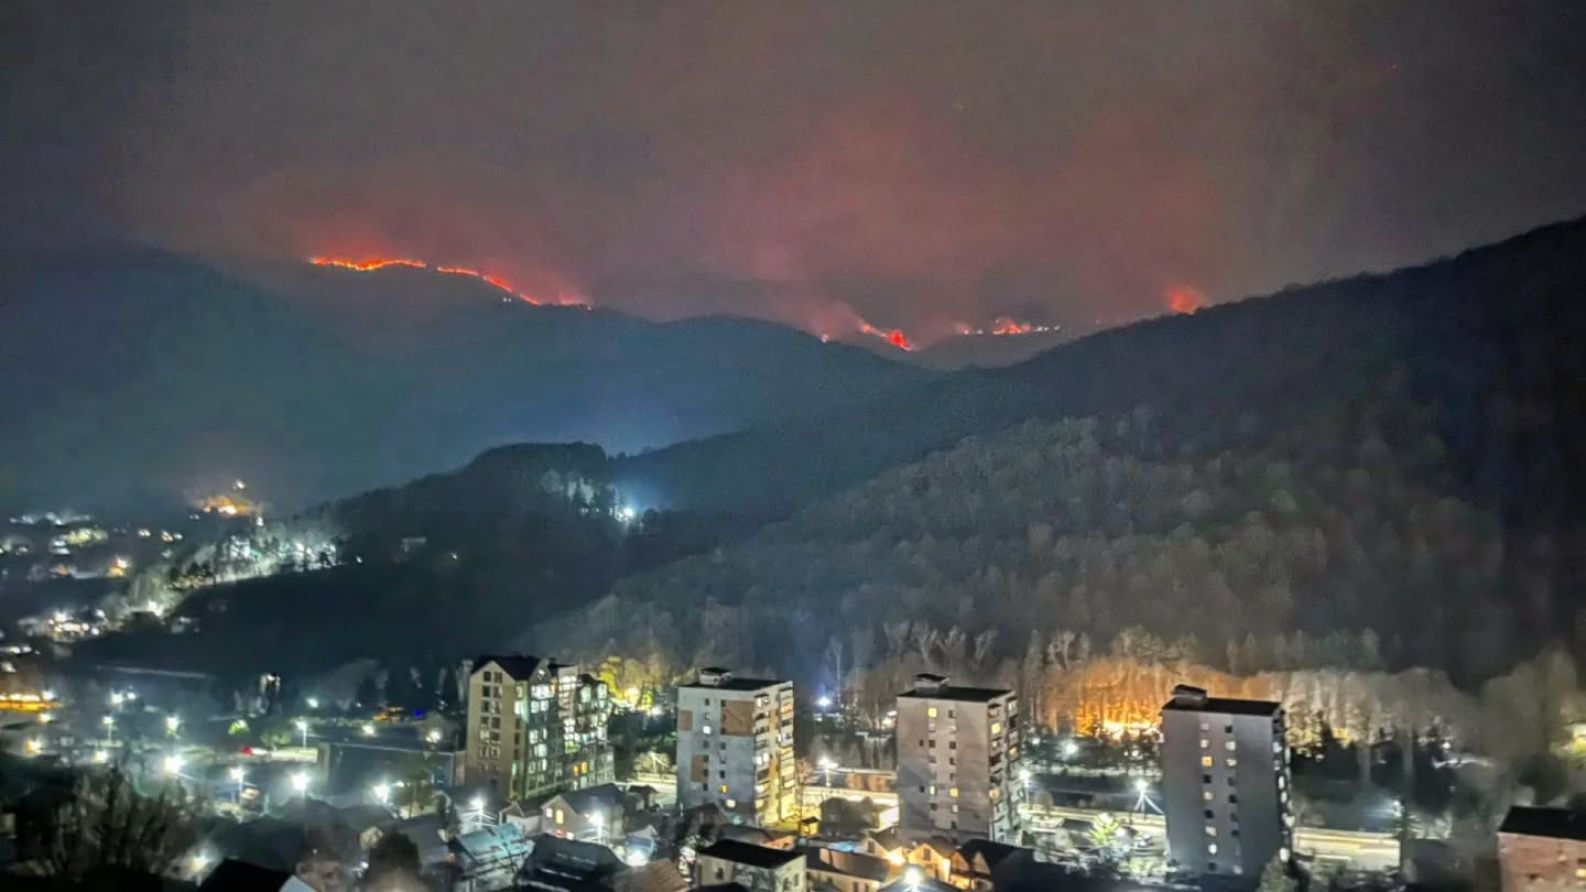
One source almost entirely absent from public discussion is the burning of waste and cheap fuel in private homes, garages, auto repair shops, and small workshops: laminate flooring, packaging film, used oil, and tires. According to observations by Yerevan Air Pollution Monitoring, all of this burns at hundreds of locations across the city in winter. Controlling these sources is incomparably harder than regulating official construction sites: they are numerous and spread throughout the city.
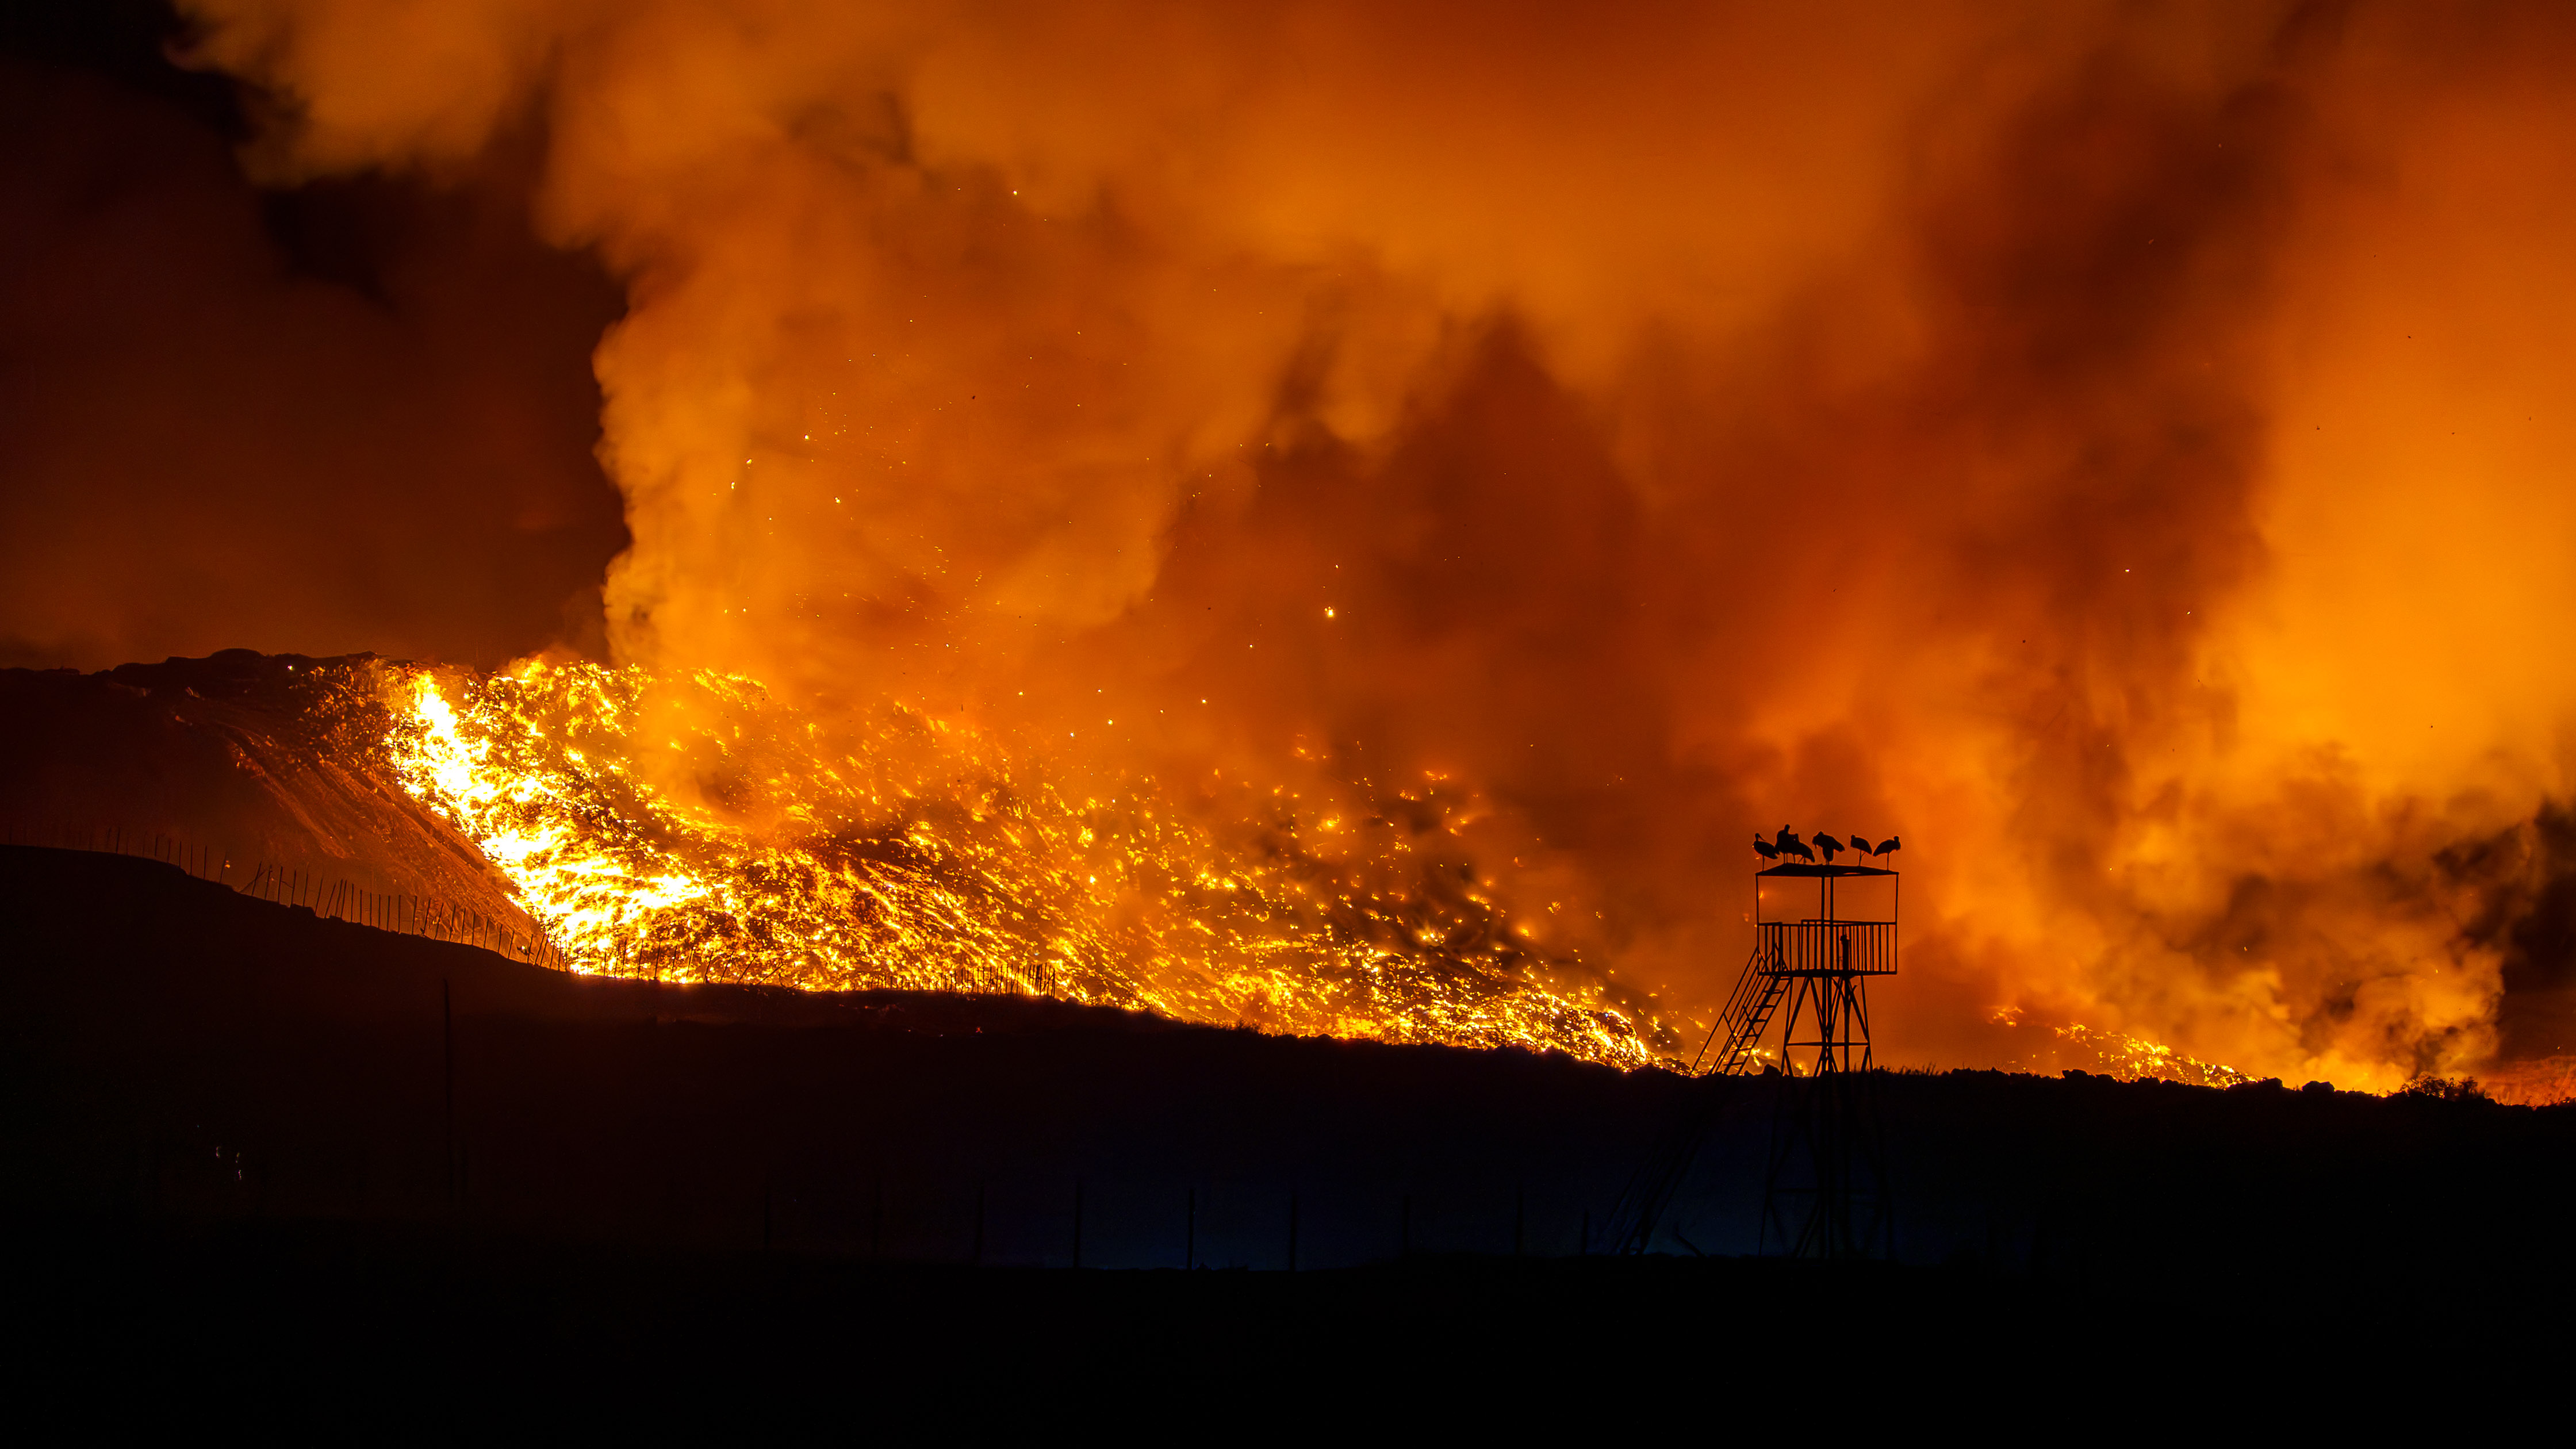
Another winter factor is fires and chronic problems at the Nubarashen landfill. In September, Sputnik described recurring landfill fires as part of the waste and environmental crisis; in October, the Nubarashen landfill caught fire again. On such days, pollution does not necessarily remain near the fire: during stagnant winter conditions, smoke and fine particles can worsen air quality across the entire city.
Construction, quarries, and traffic also remain important sources. EVN Report identified construction dust, operating quarries, vehicle emissions, and the Nubarashen landfill among the key pollution factors. Armenian Weekly separately mentioned construction without dust suppression, truck traffic, old vehicles, polluting heating, and leaf burning. Inspection reports also show that common violations include construction, waste burning, and transporting bulk materials without protective covers.
Finally, the city has less green protection. The UN noted that Armenia directs only 0.6% of GDP to environmental protection, while a Hetq investigation into reforestation showed how poorly long-term programs to restore green areas function. In February, environmentalist Zoya Dutova said that planting trees alone is insufficient without systemic changes in urban planning. This does not by itself explain sharp winter peaks, but it makes the city less resilient to dust, overheating, and pollution buildup.
Yerevan City Hall: Data, Construction, and Weather

City Hall's position changed noticeably, but two themes recurred: the municipal sensor network and the weather. In October, Mayor Tigran Avinyan said that talk of poor air in summer and autumn was inconsistent with the data, while warning that problems could begin in November. When winter pollution became clearly visible, the city quickly shifted to weather-based explanations. In January, Avinyan said the problem could not be fully solved because of factors beyond City Hall's control; in March, he attributed improving air quality to better dispersion as temperatures rose.
Weather does matter, but it is not a complete answer. Inversions and weak winds do not produce PM2.5 themselves; they trap existing emissions near the ground. Weather explains why pollution accumulates more in winter, but not where the particles come from. Heating—one of the most obvious winter factors—is almost entirely absent from these explanations. The daily pattern also cannot easily be reduced to construction or external emissions alone.
City Hall did not rely solely on weather. In November, Avinyan said that leaf and waste burning must be tackled and that the city needed additional enforcement powers. In January, City Hall announced a tender to build and operate a waste-processing plant in Nubarashen. This could become an important long-term measure against landfill smoke and fires. But by the end of winter, public materials still showed no clear city program matching the scale of the problem.
Ministry of Environment: Monitoring and a Five-Year Plan

The Ministry and related agencies focused mainly on improving monitoring and regulation. In September, Armenia and Japan signed an agreement for a grant of approximately $1.7 million to modernize air-monitoring stations. In December, the government approved procedures for state monitoring, collection, analysis, and publication of air-quality data, including an air quality index and alert thresholds.
Earlier, on December 10, a prime-ministerial decision created an interagency working group on air pollution, chaired by Deputy Prime Minister Tigran Khachatryan. The group's head must report results to the prime minister every 15 days, and its activity must be publicized monthly. On paper, this is an important mechanism. Public information, however, does not yet show what decisions the group has made.
In January, Armenia announced approval of a comprehensive atmospheric-air protection program for 2025–2030. It includes modernized monitoring, new automatic stations, and mandatory dust-suppression equipment in construction and mining. Six automatic stations were announced for Yerevan: two have been installed, but their data is not yet publicly available; later reports said the stations in Kentron and Kanaker-Zeytun were undergoing testing and verification.
Public comments still reveal reluctance to acknowledge the scale of pollution and distrust of independent data. In the same Ecolur report, the head of the inspection body said some platforms' high-pollution readings might be inaccurate because of instrument error, while the agency's checks found no critical problem. To residents, this sounds simple: an obvious problem is being denied.
Work is taking place, but it remains insufficient for the scale of the problem. According to data published by Ecolur, there were 617 air-protection violations in 2025, including 217 in Yerevan. Common violations included construction, burning waste, leaves, and stubble, and transporting bulk materials uncovered. Yerevan alone recorded 99 construction violations.
Health-risk warnings remain a weak point. In November, a representative of the Ministry of Health's National Center for Disease Control and Prevention said that Yerevan's pollution indicators were within acceptable limits and no special measures were needed. Yet he also advised keeping windows closed near fire zones and avoiding physical activity. The result is contradictory: people are told everything is normal, then advised to exercise caution. PM2.5 warnings should therefore be tied to an understandable AQI scale and specific recommendations, not only general statements about acceptable limits.
The authorities also announced stricter air-quality standards from 2030. For PM2.5, maximum permitted concentrations are to fall to 25 µg/m³ as a daily average and 10 µg/m³ as an annual average; tighter standards will also apply to nitrogen dioxide, sulfur dioxide, carbon monoxide, and other pollutants. This is important, but public warnings are a separate issue: people need timely, plain-language messages linked to AQI and specific recommendations.
What Residents Say
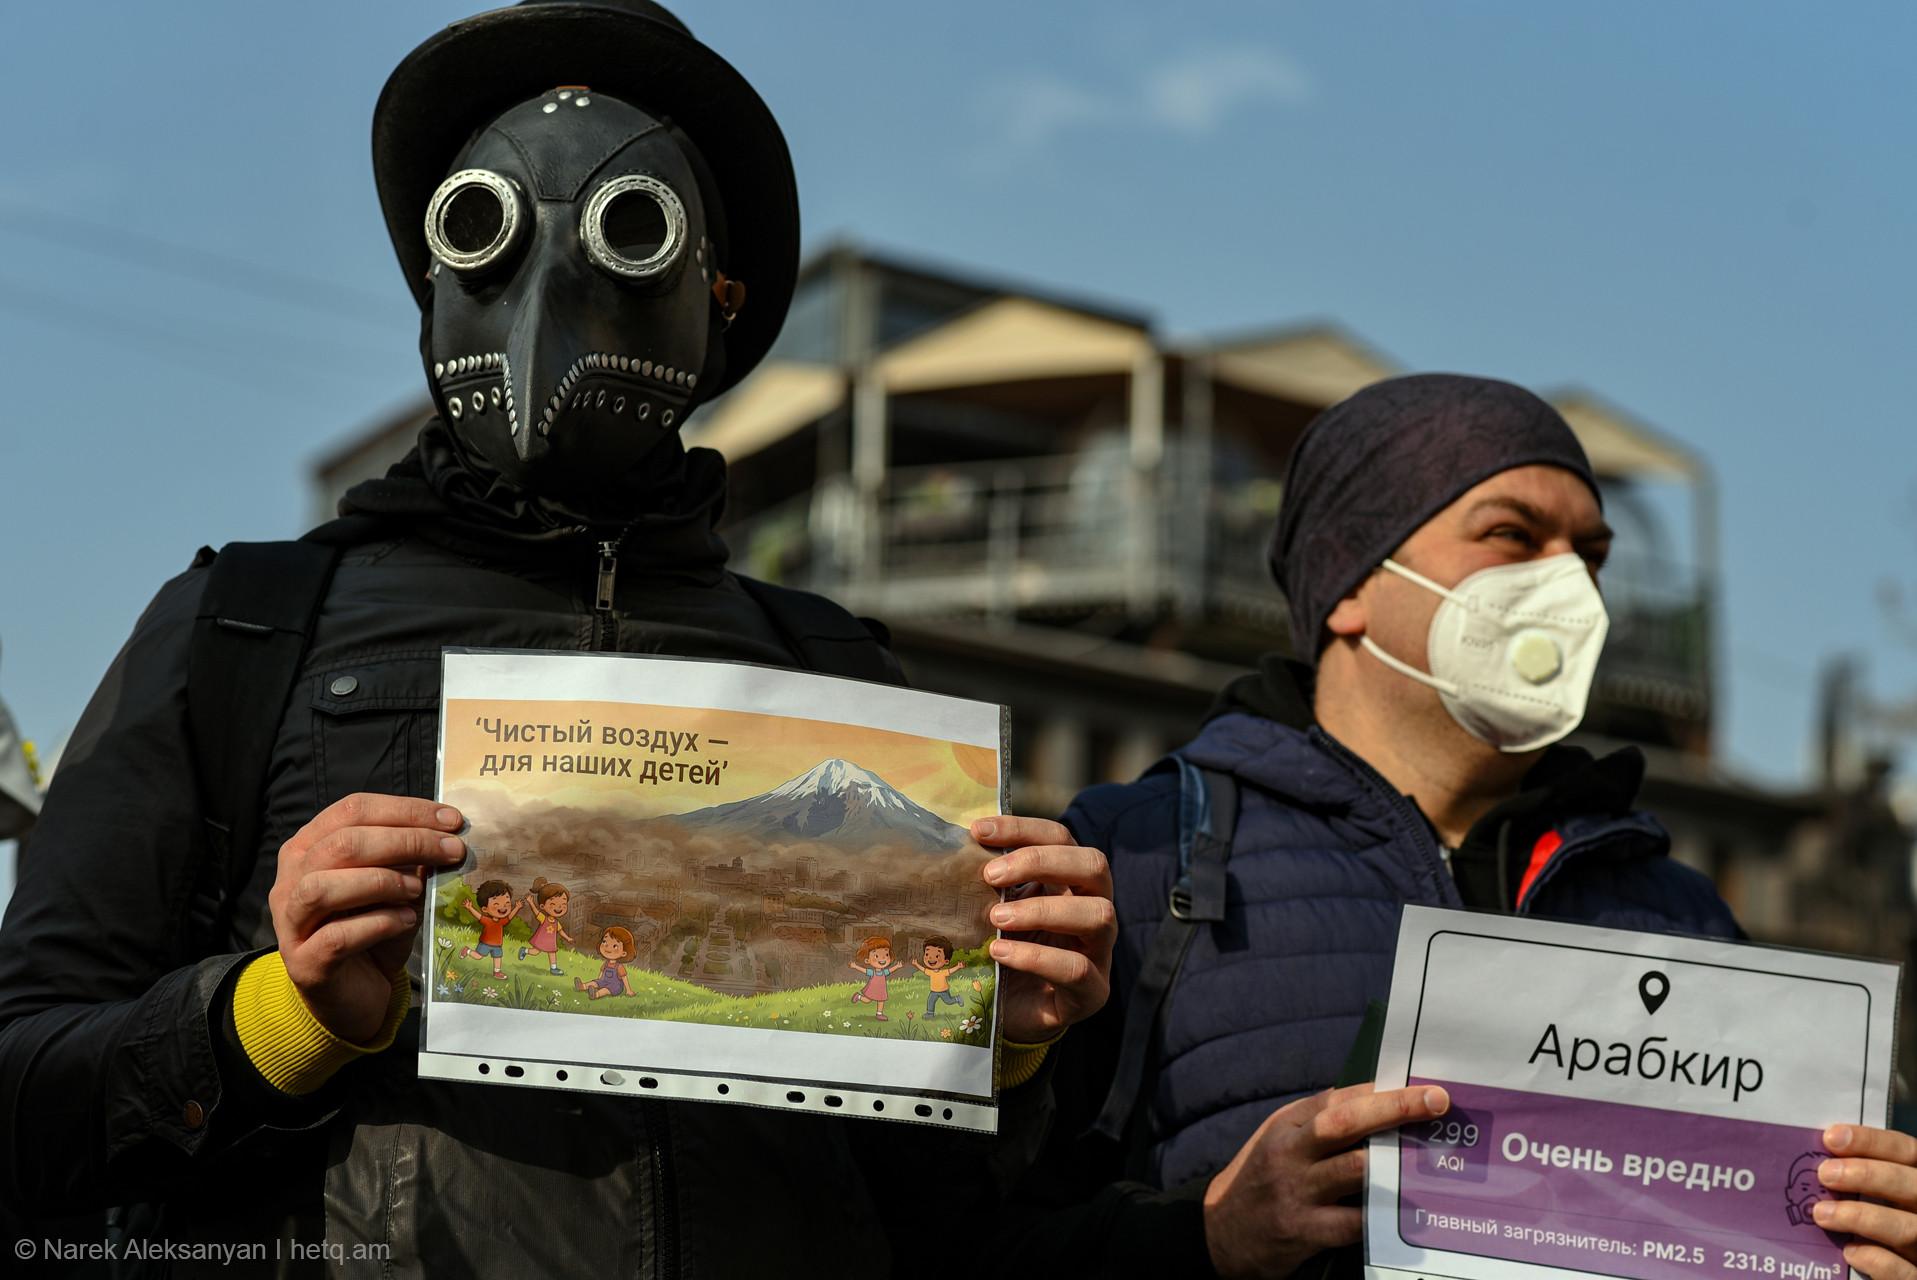
Air pollution has already become one of the city's main problems for residents. In a January GALLUP survey, about 30% of respondents called it Yerevan's most important problem; the survey covered 601 participants on January 19–23. In February, nearly 1,900 respondents to a poll by the “Yerevanch” Telegram channel named mass tree planting, strict construction-dust controls, fines for waste burning, transition to gas or electric heating, and expanded gas supply among their preferred measures.
These responses clearly show the gap between official explanations and residents' expectations. People care less about what share of pollution comes from weather, construction, traffic, or heating. They want to be able to breathe in the city during winter. Weather may explain why the problem intensifies, but it does not remove the authorities' responsibility for controllable pollution sources. Snow also melts in spring, but that does not mean it should not be cleared in winter.
Conclusions and Expectations for Next Winter
The data shows that poor winter air in Yerevan is neither a myth nor a handful of isolated days. In winter 2025/26, daily PM2.5 exceeded 15 µg/m³ on 138 out of 151 days, although WHO guidance allows such exceedances on only 2–3 days per year. The monitoring network has become denser, especially through municipal sensors, making it harder to dismiss poor readings as the result of a couple of badly located devices.
Weather matters: inversions and weak winds prevent pollution from dispersing. That is precisely why emissions must be reduced where they can be controlled. The daily pattern calls for closer scrutiny of heating, traffic, and the burning of leaves and waste. If nothing is done about these sources, future winters can easily repeat this one.
City authorities never arrived at a clear position. Some statements attributed the problem almost entirely to weather; others shifted attention to construction and leaf burning. No comprehensive approach to winter pollution is visible: heating is almost absent from public discussion, while discussion of data often turns into an argument with independent measurements. The Ministry of Environment is still focused mainly on developing the monitoring system—new stations, state-monitoring procedures, alert thresholds, and new standards. These are necessary, but results are not yet visible in public sources. Two state stations have been installed in Yerevan, but their data has not yet become part of the overall picture.
By next winter, we want to see results rather than new explanations. First and foremost, public information about the new monitoring system: where stations operate, which pollutants they measure, where the data is available, and how it is used for alerts. The interagency working group, which is required to report regularly, should publish its decisions. City Hall should report on its four-year plan and what has been done regarding transport, construction, greening, heating, and waste burning.
Nubarashen is a separate issue. The results of the waste-processing plant tender should be announced in the coming months, clarifying what work is expected and at what scale. For air quality, not only the timetable matters, but also requirements for emissions control and reducing fires and landfill smoke.
For its part, AirQuality.am will continue monitoring air quality, collecting data, and following the authorities' actions. By autumn, we will check whether reports and answers have appeared on the points above. If not, we will submit formal requests. We will also continue explaining air monitoring in plain language. The more people understand that winter smog is not normal, the harder it becomes to blame the problem on weather and the greater the pressure on authorities to address it. Autumn will show whether these programs, tenders, and working groups were real steps or merely a way to get through winter—during an election period, at that—without inconvenient questions.
Who Are We?
AirQuality.am is a project about air quality in Armenia. We collect data from municipal, state, independent, and community networks, bring it onto a common scale, and publish it for residents, researchers, and government bodies to use.
You can follow air quality on the website, through our Telegram channel with pollution alerts, and in our iOS app with quick-monitoring widgets.
Update (August 2026): The Android app is now also available on Google Play.