I finally finished a major service update! Due to work overload and heavy involvement with Green Green, the update took longer than I expected, but here we are!
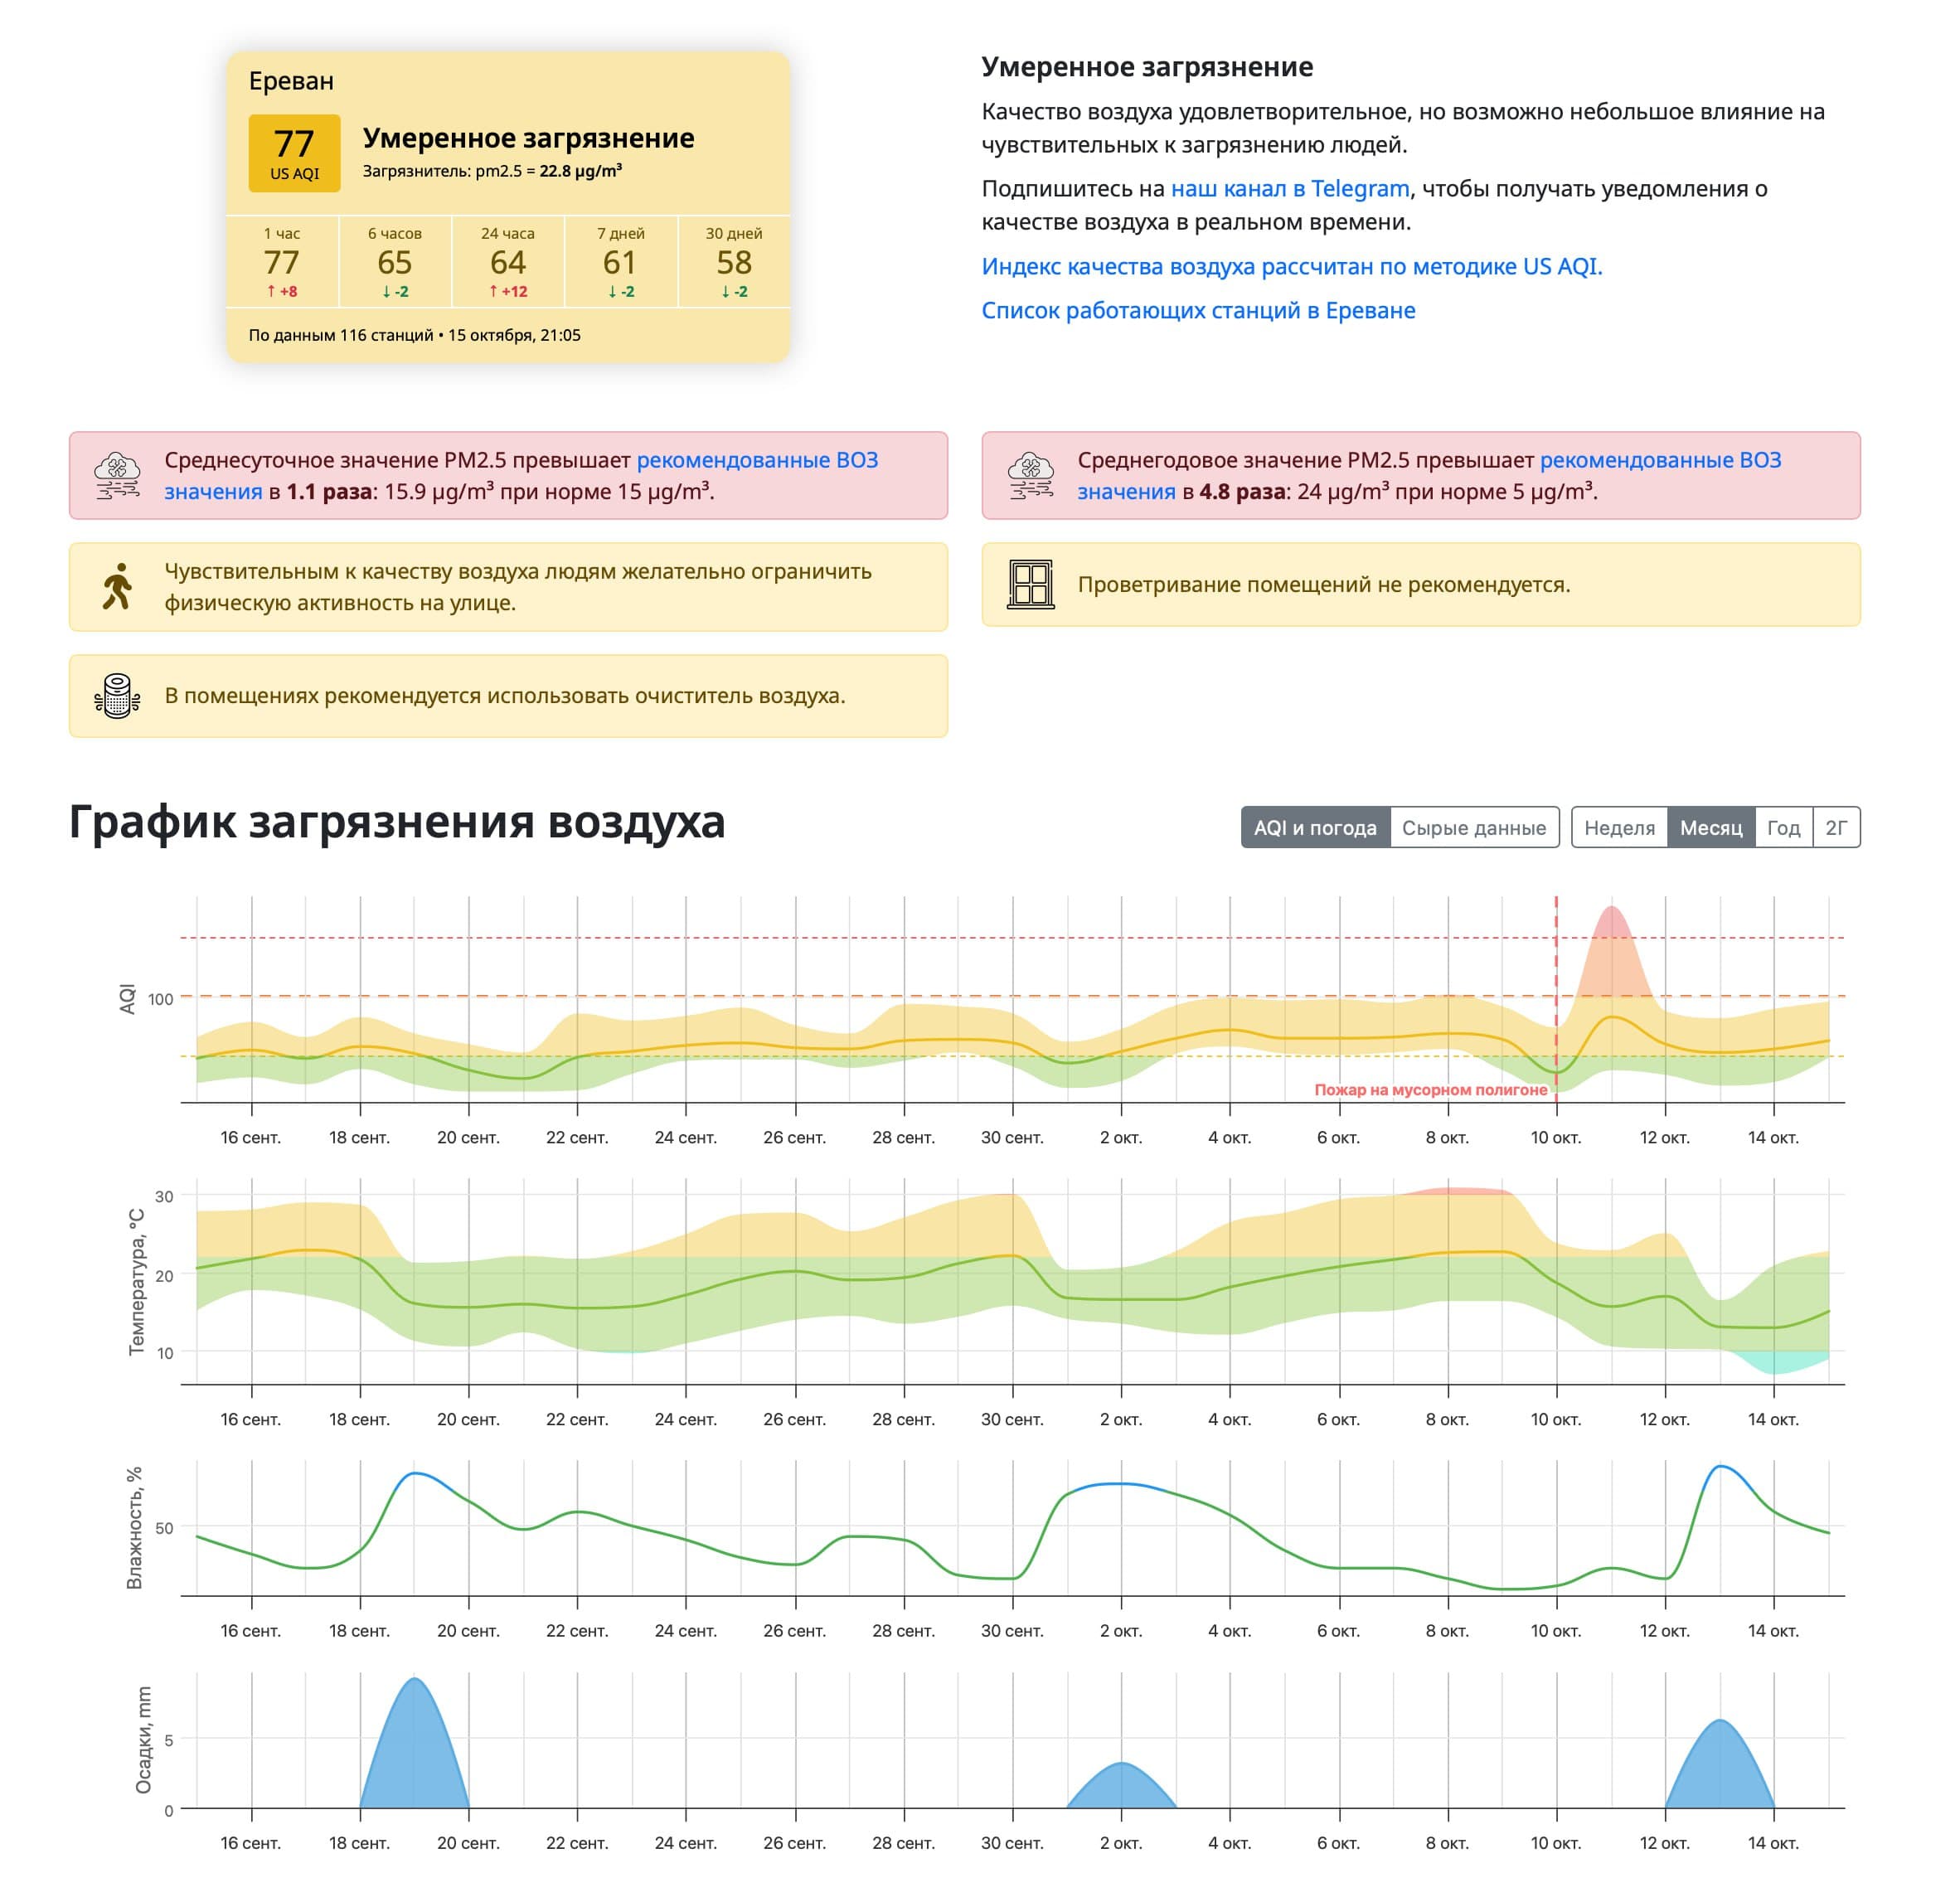
Charts now display the range of values over a period, not just the average — you can see the limits within which indicators change over a day, week, or month.
🔥 Important events, such as the Nubarashen fires, are marked on the charts.
☢️ Radiation background sensors from GMCMap connected
Radiation levels are normal, but we're monitoring just in case :)
🌦 Weather service data
We're receiving (albeit not in real-time) information from official weather stations and air monitoring stations. There's data from April on dust, NO₂, SO₂ and O₃, and on precipitation — not only in Yerevan but also in other cities. Such points on the map are marked in blue.
💨 AirGradient sensors connected
Another open platform for air quality monitoring.
🌫 NO₂ available at Clarity and Yerevan municipality stations
Since spring, Clarity has calibrated the network and publishes NO₂; we save this data, display it on charts, and include it in AQI calculations.
💚 Thanks for your support